Power Price Regimes
Why power prices no longer follow one daily shape, and what that means for anyone modelling solar or battery revenue
Jacopo Buriollo, founder and CEO, Megawatt
In brief
A power price curve used to have a shape you could describe: a morning peak, a midday dip, an evening peak. Revenue models were built on that shape. Take a typical day, apply a capture rate, multiply by the year. Prices now move between distinct regimes instead, each with its own behaviour, and the same hour can sit in a different regime from one day to the next. An average of regimes describes a day that rarely happens, and it hides where the revenue is actually earned. The models that are easiest to build and defend are the ones that describe the market least well, which is a bad incentive for anyone financing energy assets.
The shape we used to model
For a long time, the daily price curve in most European markets was predictable enough to summarise. Demand rose in the morning, eased in the middle of the day, and peaked again in the evening. Prices followed.
That made revenue modelling manageable. You could take a representative daily shape, perhaps one per season, estimate how much of that shape an asset would capture, and turn it into an annual figure. The approach was never perfect, but the shape was stable enough that the errors stayed small.
From a shape to regimes
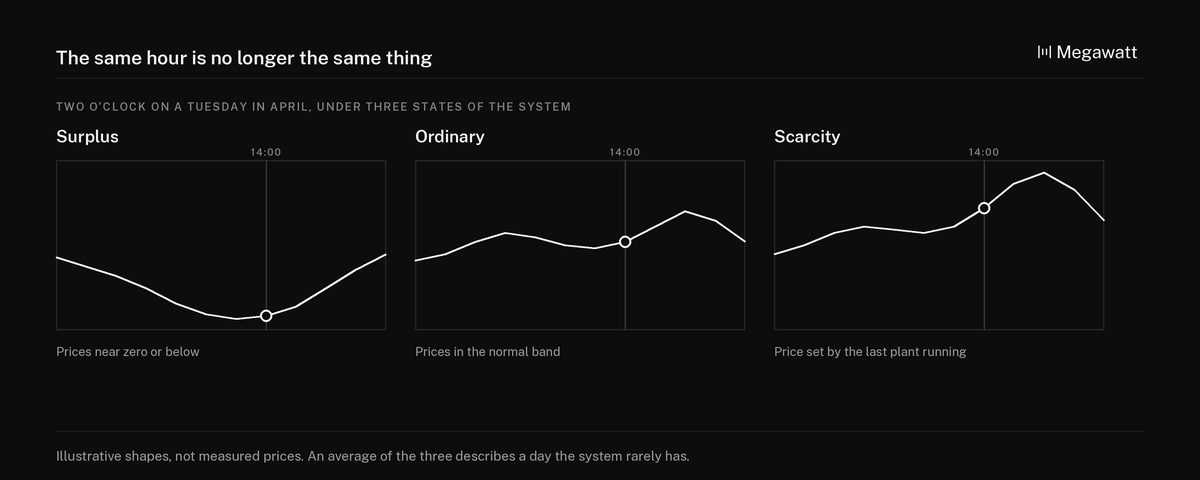
A regime is a distinct state of the power system with its own price behaviour. A sunny, windy weekend with low demand is one regime: surplus generation, prices near zero or below, exports pushing against the limits of the interconnectors. A cold, still winter evening is another: scarce supply, imports at capacity, prices set by the most expensive plant still running. Between them sit several more, and the system can move from one to another within a single day.
What matters is that the same hour no longer means the same thing. Two o’clock on a Tuesday in April might be a surplus hour one week and an ordinary one the next. The calendar tells you less than it used to. The state of the system tells you more.
What pushed the market this way
Four changes, working together:
Renewables move the merit order faster. Wind and solar output can swing by large amounts within hours, and every swing changes which plant sets the price. The more renewable capacity a system has, the more often the marginal plant changes.
Transmission constraints create abrupt changes. When an interconnector reaches its limit, a market stops sharing prices with its neighbour and starts behaving on its own. That switch can happen suddenly, and it can change prices on both sides of the border.
Neighbouring markets influence each other. European markets are coupled, so a surplus or a shortage in one country is felt in the next. A regime can be imported.
Fifteen-minute settlement exposes what hourly prices hid. Since 1 October 2025, the European day-ahead market has priced electricity in fifteen-minute intervals rather than hours. Volatility that used to average out inside an hour is now visible, and tradeable.
Why the average misleads
Averaging regimes produces a shape that looks reasonable and describes a day the system rarely has. That matters for three reasons.
Revenue is earned unevenly. A battery earns most of its money in the transitions between regimes, when prices move sharply. A solar farm earns least in the regime where it produces most, because that is when everyone else is producing too. An averaged shape spreads those effects across every day and blurs both.
Rare regimes can carry a large share of the year. A handful of scarcity evenings can account for a disproportionate part of a battery’s annual revenue. If those evenings become rarer, or more common, the annual figure moves far more than an averaged shape would suggest.
Regimes are recognised too late. A regime has to be identified before an asset can act on it, and by the time it is certain, the hours have often passed. An averaged model implicitly assumes the asset always knew which day it was in.
The incentive problem
There is a reason averaging persists. It is manageable: take a shape, apply a capture rate, produce a number a credit committee can discuss. Every step is easy to explain and easy to check.
Treating price as a set of regimes with transitions between them is harder to build, harder to explain, and much harder to defend in a meeting. It produces ranges and conditions rather than a single number.
So the model that is easiest to build, and easiest to approve, is the one that describes the market least well. That is a bad incentive, and it is not unique to energy. It appears wherever a simple summary is easier to sign off than an accurate description.
What a better model shows
A revenue model that takes regimes seriously does not need to be impenetrable. It needs to show a few things an averaged model hides:
- Revenue by regime. How much the asset earns in each regime, rather than only in total.
- How often each regime occurs. And how that frequency has changed over recent years, since a regime that is becoming more common changes the forecast more than any single price assumption.
- How concentrated the revenue is. What share of the year’s revenue comes from the rarest regimes, and what happens to the total if they become rarer still.
- Stress cases defined as regimes. A windless winter week, a sunny spring with low demand, a period of constrained interconnection. These are easier to reason about than an abstract percentage cut.
The same logic connects to two other questions covered here: whether a battery’s revenue streams can really be added together, in Battery Storage Revenue Stacking, and how far a published benchmark sits from what an asset keeps, in Battery Storage Revenue Benchmarks.
What to ask for
Anyone reading a solar or battery revenue model can ask:
- Is the price assumption a single shape, or does it distinguish between regimes?
- What share of the modelled revenue comes from the rarest conditions?
- How has the frequency of those conditions changed recently, and what does the model assume about the future?
- How does the asset perform in a defined stress regime, rather than under a general percentage reduction?
Where this is heading
Markets are producing more granular data every year, and fifteen-minute pricing has added to it. That makes regimes easier to identify after the fact, and over time, easier to model in advance. The models that will be trusted are the ones that show their working: which regimes they assume, how often, and how much of the answer depends on the rare ones. An average is easier to approve. A model that shows its regimes is easier to believe.
Key questions
What is a power price regime? A distinct state of the power system with its own price behaviour, such as a renewable surplus with very low prices or a scarcity period with very high ones. The system can move between regimes within a single day.
Why do averaged price shapes mislead revenue models? Because revenue is earned unevenly across regimes. Averaging spreads the effects of rare, high-value or low-value conditions across every day and hides how much of the annual figure depends on them.
What changed to make power prices behave in regimes? Faster swings in renewable output, transmission limits that switch markets between sharing and separating prices, coupling between neighbouring markets, and fifteen-minute day-ahead pricing in Europe since 1 October 2025.
How do price regimes affect battery storage revenue? Batteries earn much of their revenue in transitions between regimes, when prices move sharply. The frequency of those transitions matters more to a battery’s revenue than the average daily price shape.
What should investors ask for in a revenue model? Revenue by regime, how often each regime occurs and how that is changing, how concentrated the revenue is in rare conditions, and how the asset performs in defined stress regimes.
Source for the fifteen-minute day-ahead change: Single Day-Ahead Coupling (SDAC) go-live of the 15-minute market time unit for delivery day 1 October 2025, as announced by the Market Coupling Steering Committee.